Email Tracking Statistics Page Explained
-
Email Tracking
When you use Email Tracking to know more about customers' or agents' actions, you might probably want to view the statistics. Fortunately, the app offers two tabs on the Statistics page - Mail tracks and Link tracks. So, let’s dive into analytics in more detail.
Mail Tracks Statistics
To open the Statistics page, click on the Bar Graph icon on the app’s hand-left side of the control bar. There are two statistic tabs available, so we start from the Mail tracks tab.

The first thing you might notice is filters and metrics. All metrics are devided to three sections (Engagement Metrics, Rates, Time) for better visibility.

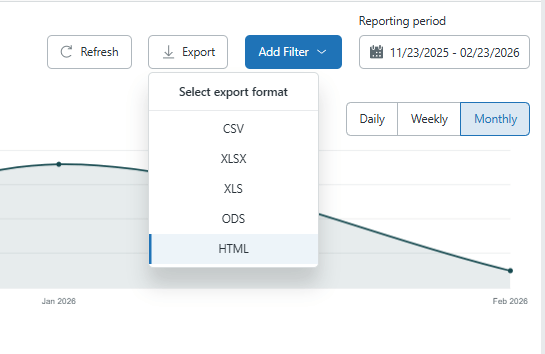
1. Click on Add Filter to open the dropdown with filters. So, the first filters are the Default Filters, which include Agents, Ticket Tags, and Triggers. For example, when you choose the Agent filter, you can see the Is filter and select specific agents or agent groups for specific metrics.
2. Select a tag in your statistics to create charts by marked emails.
3. The next filter is Data for triggers which helps to sort out the data by existing triggers.
4. Another section is created for those who use Proactive Campaigns. It allows them to send out mass email campaigns to contact lists. So, you can track the open email statistics for messages sent through the Proactive Campaigns.
5. And the last one is Data for ticket fields. Here you can select custom fields and set necessary values to make the data more accurate. To adjust custom fields, visit the Settings page and find the 'Select custom fields to retrieve statistics from' section.

The reporting period allows for creating a statistics report for exact days, weeks, or even years. For this, choose the Start and End date or one of the proposed periods, such as the Last 6 months, Last 3 months, Last month, and Previous month. 
Besides, you can use the Daily, Weekly, or Monthly statistics display.

So, let's move to charts and indicators. Charts show the visual correlation of different types of indicators and their changes over time. The following are essential email-tracking indicators.
- Emails sent - this index displays the number of emails you have sent since you started using the application.
- Opened - shows the count of emails opened by its recipient and tracked by the app.
- Replied - displays the general count of replied emails by recipients.

- Opened Average Rate - displays the percentage of emails that the recipients opened. This indicator has its own tab.

- Emails Unread - indicates the number of emails that were sent through the Email Tracking app but weren’t opened by their recipients.

- Average Time from Sent to Open - our app will track and display the average period it takes for your recipients to open the email after it was sent.

Now, let’s move on to the most exciting part - Agent comparison (Available only for Pro plan). Here, you can select two or more agents and compare their results by analyzing the differences in Sent, Opened, and Replied emails.

And finally, export reports in the most convenient file type (CSV, PDF, XLSX, XLS, ODS, or HTML).

Link Tracks Statistics
Now we will figure out how you can check the statistics for the Links Tracking option. To view the general link statistics, click on the Link tracks tab on the top right-hand side of the page.

The logic of items' positions and content is similar to the Mail Tracks Statistics tab. So, here you can select a specific period, agent, or/and group to see how many links were sent by a support representative or team.
Also, look through another links indicators to know the quantity of Links sent and Opened, the Opened Average Rate (shows the percentage of all followed links in the app), the Unopened links (depicts the quantity of ignored links), and the Average Time from Send to Opened (counts the general time that spends until the receivers follow URLs).
Like on the Mail Track tab, view the Line Graphs, which are the visual reflections of block indicators.
Besides, you can also use the Agent Comparison tab to compare agents' performance.
Along with it, download a links statistic report in a convenient format: CSV, PDF, XLSX, XLS, ODS, and HTML. Just click on the Download button and select the file format from the dropdown menu.
All these settings on the Statistics page are created to assist your understanding of how certain emails or email campaigns perform over time and which works better at what time.
And that’s all for today. If something is unclear or you have any additional questions, make sure to contact our super-helpful support agents.


