How do reports work in CRM and Kanban for Zendesk?
- CRM and Kanban
The Reports page in CRM and Kanban (formerly CRM and Deals) is a tool to help you check the statistics of won or lost deals their values and terms and many other parameters shown in this article. Also, you can export all data to the CSV file to use them for corporate presentations, or store it in your local database, for example. Now, let's see how to interpret all the info located here.
There are two main blocks on the Reports page: Filters and Charts. We’ll overview Filters first.
Filter by Group and Filter by Agent - both options allow choosing groups of agents or specific agents by which the statistic is displayed. As a result, you’ll always know how well sales and support agents performed.
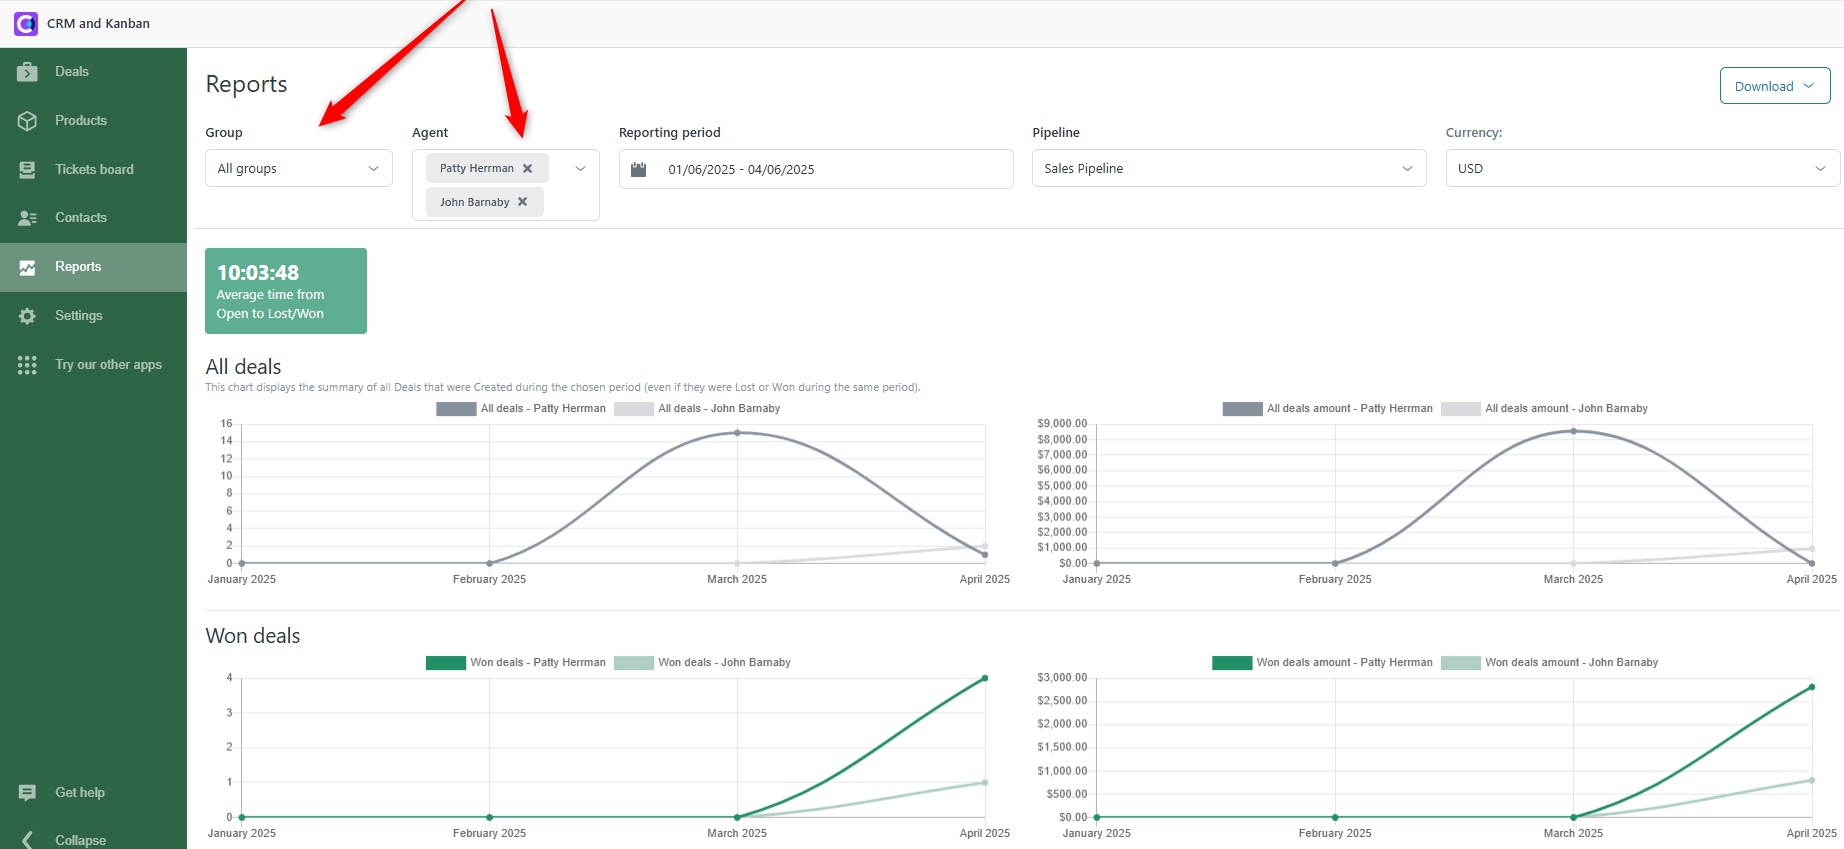
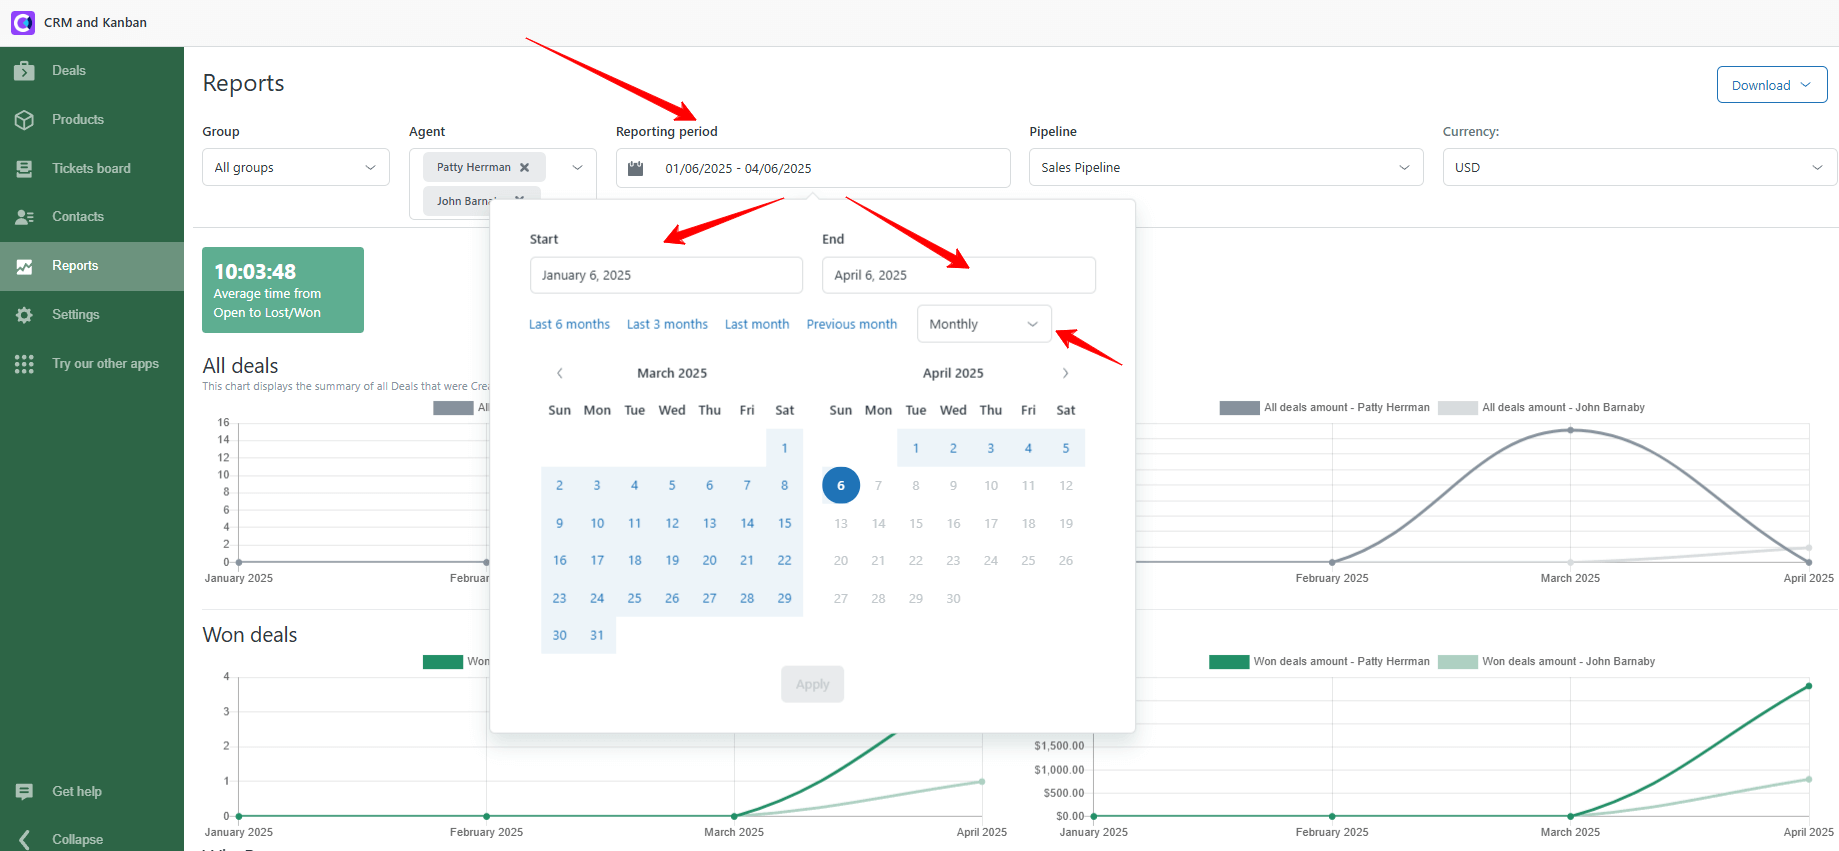
Reporting period filter displays the time interval of the whole statistics. You can select the Start and the End date or a proposed period. Also, data can be divided and displayed daily, weekly, or monthly.
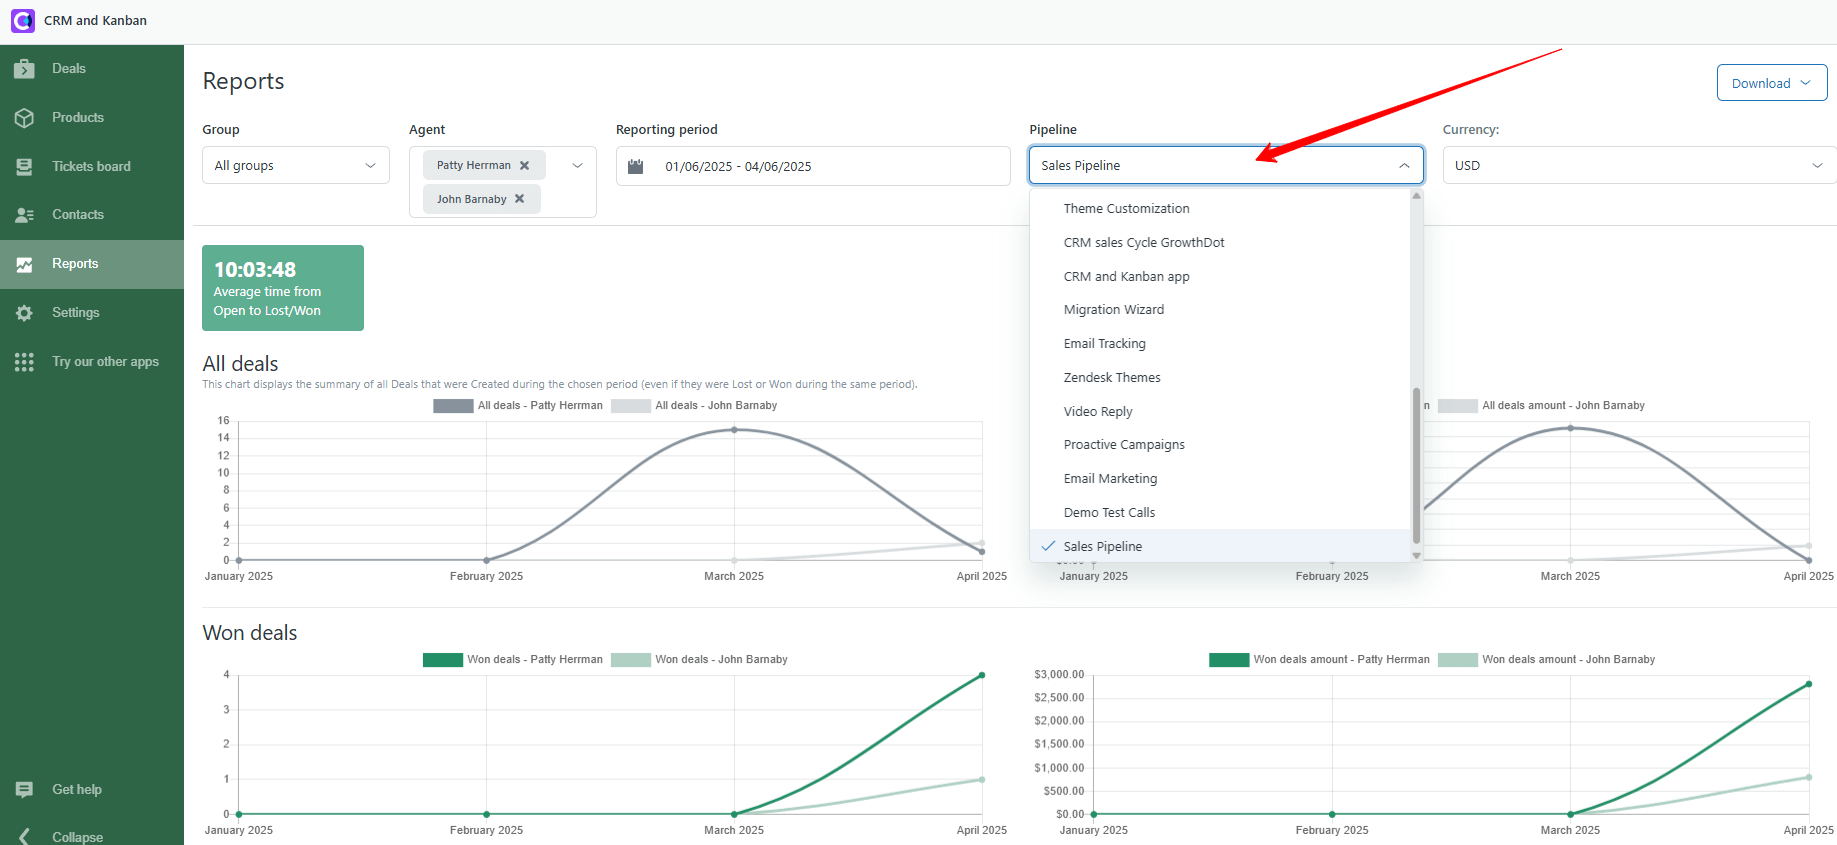
Next, there’s a Pipeline filter. Choose the needed pipeline on the Reports page.
Also, you can filter the stats by selecting the currency from the drop-down.
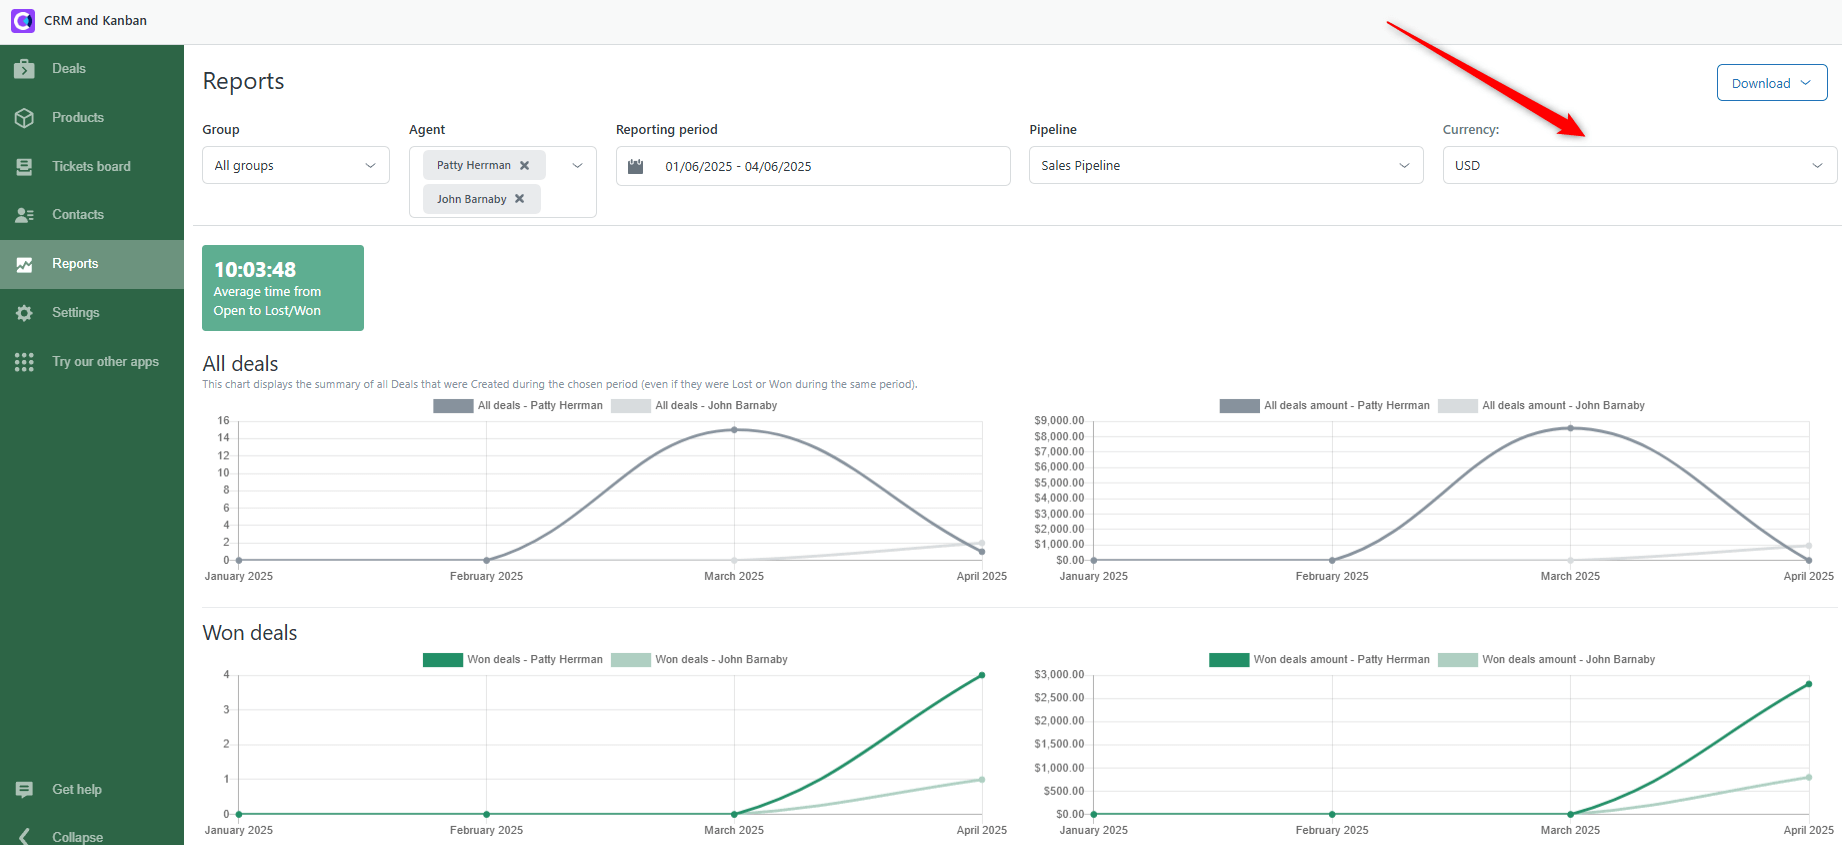
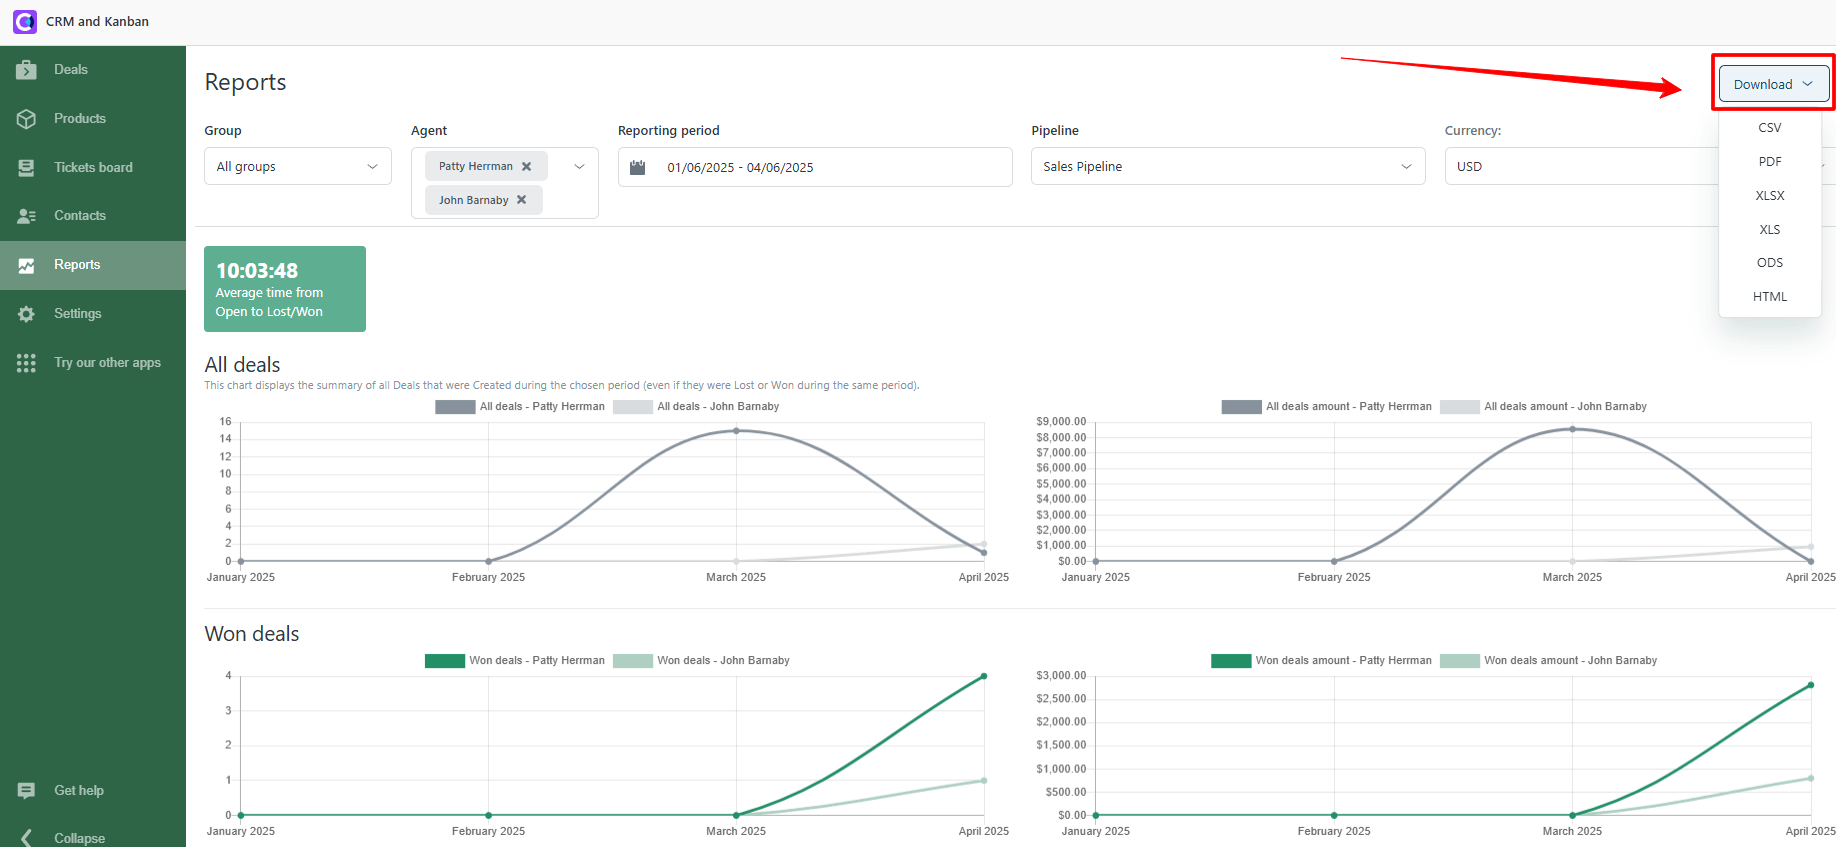
Note: You can export the statistics to several file formats if needed. Just click on the Download button on the right top of the Reports tab.
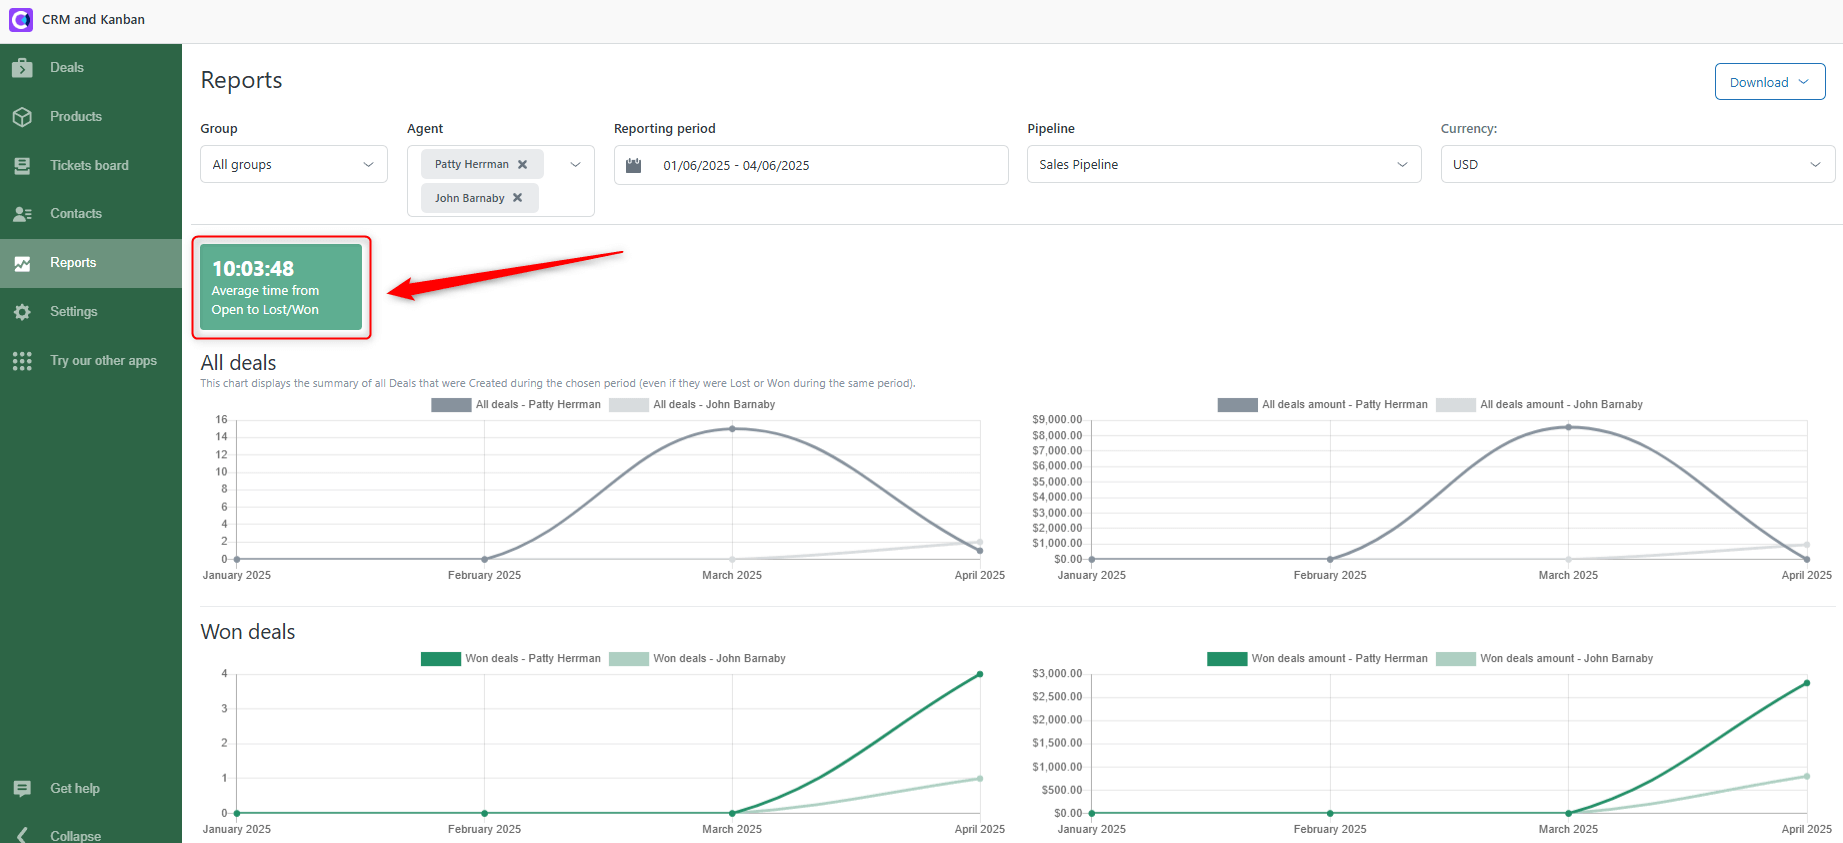
There is also an index called Average time from Open to Lost/Won. That means the average time it takes for your agents to close the deal.
Now, let’s move to an explanation of a Chart block. Data shown on the charts changes depends on the configurations of your filters.
All Deals - this shows the variation of all created deals for the chosen period.

All Deals Amount - displays the fluctuation of all created deals with the addition of their value in the chosen currency for the selected period.

Won Deals - displays the quantity and dynamics of won deals for the chosen period.

Won Deals amount - shows the dynamic of won deals for selected time segments with the addition of their value in the chosen currency.

Win Rate - Shows the percentage of won deals during a particular time.

Average Order Value - indicates the average value of the chosen deals for the selected period.

Lost Deals - displays the quantity and dynamics of lost deals during the selected time.

Lost Deals amount - shows the dynamic of lost deals for chosen period with the addition of their value in the chosen currency.

At the bottom of the page, there’s a Lost Reasons Count and Lost Reasons Amount statistics. You can select lost reasons and their children (sub-reasons) to receive a radial chart’s statistics about the amounts of lost reasons and their monetary values.

Reports page is created to assist you in analyzing sales data and improving your sales funnel. If you have any questions, contact our support agents.


