Video Reply for Zendesk Reports Page Explanation
-
Video Reply
Video Reply app records videos directly from Zendesk tickets. This simplifies the communication between the client and agent. But recording and organizing videos is not the only feature of the app. Statistics and reports have no less value because they help to analyze the value of the video messages you send. If you were having difficulties with understanding what each video report chart means, this article is for you. So, let's get down to the statistics page explanation.
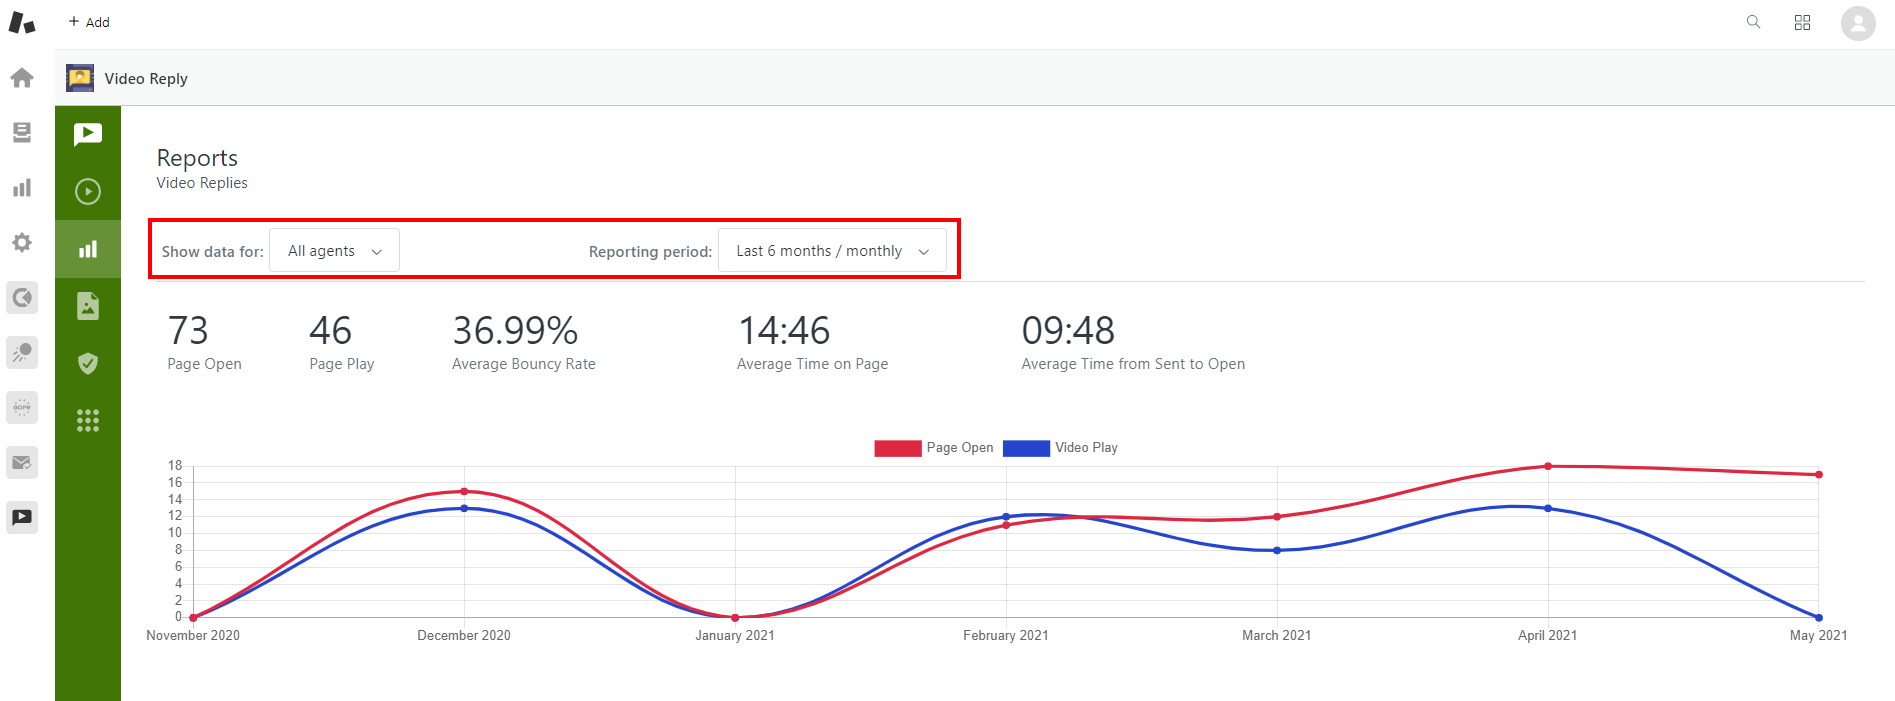
The Reports page has a block with filters to sort the information by agent and reporting period filter:

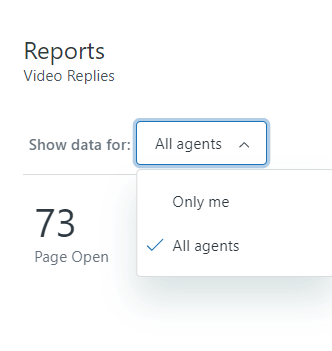
The app shows data for “Only me” or “All agents”.

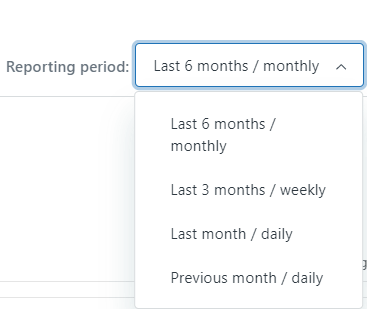
Selection of the reported period is also available, just click on the drop-down.

Previous month and Last month, are short periods, so the Statistic is divided by days.
Last 3 months and Last 6 months are long periods so the charts display data weekly and monthly accordingly.
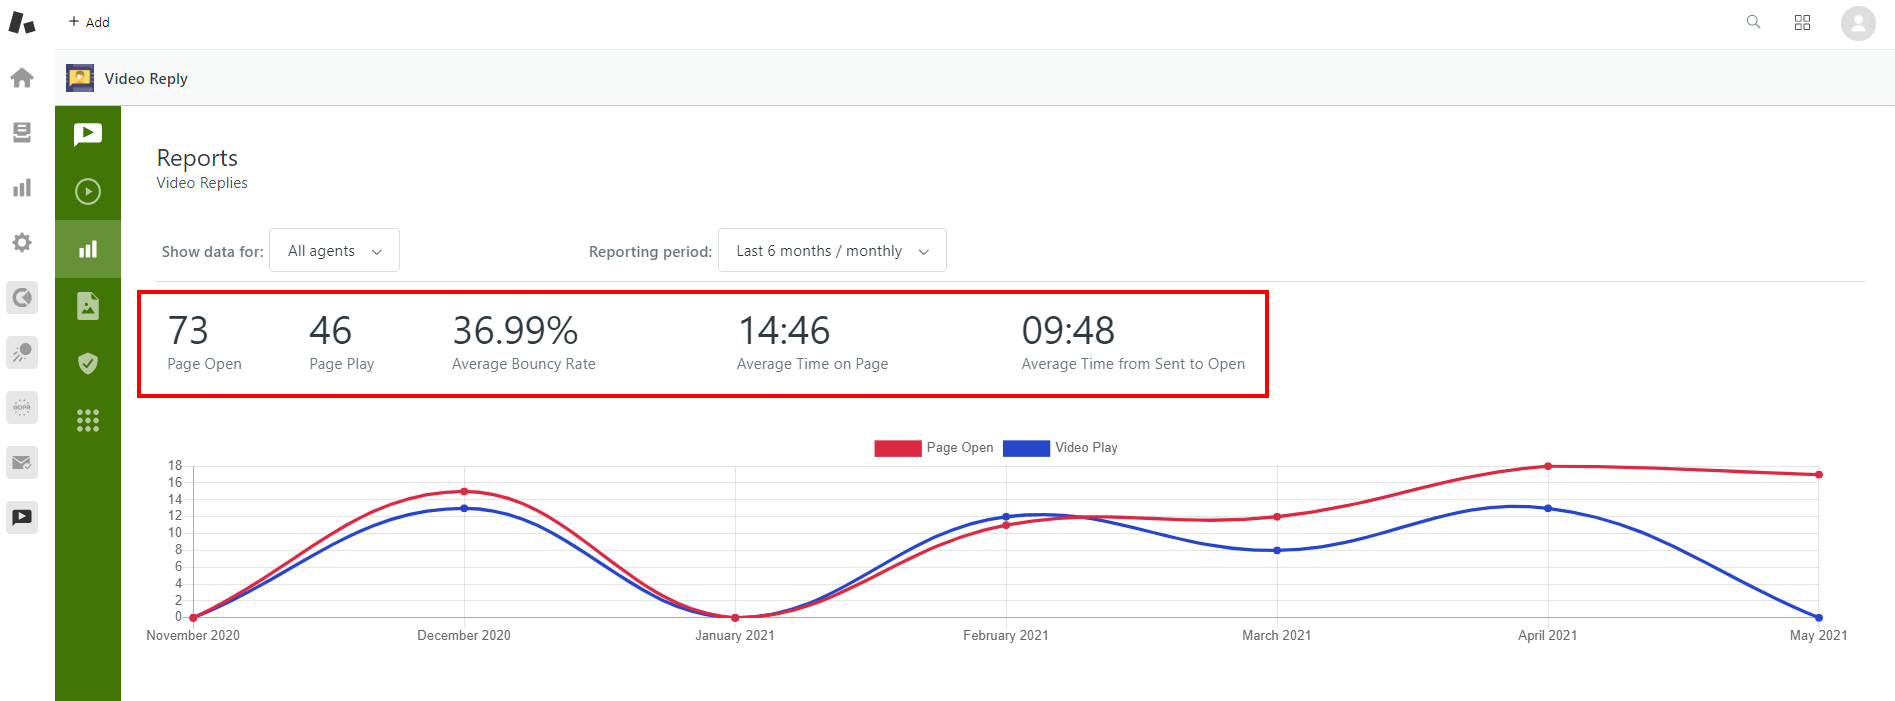
Under the filters you can find five blocks with such indexes:

Page Open - shows how many times video replies were actually opened by the recipients;

Page Play - shows the number of video views;

Average Bounce Rate - displays the percentage of video messages that were opened, but weren’t viewed. The app counts if by the formula: (1 - (amount of played videos / general amount of opened replies) * 100%

Average Time on Page - displays the whole time period which was spent on the page with the video.

Average Time from Sent to Open - shows the average period of time it takes for your recipients to open the video messages after they were sent.

Every index is a foundation for forming charts on the Video reply for Zendesk, so let’s move to them as visual representation is the most important part.
The first chart shows the difference and correspondence between Video Opens and Video Plays:

The second chart visualizes changes in the Average Bounce rate.

The third one lets you compare the Average time on the page in different time periods.

The last chart is “Average Time from Send to Open” (which speaks for itself by the way). It will be helpful when analyzing the recipients’ behavior.

This page was made to simplify your support’s daily work and your analysis processes. If you have some questions feel free to contact us!


