How to Check Statistics in Proactive Campaigns
- Proactive Campaigns
While working with Zendesk, you might want to analyze data collected in it for different purposes. So, in this article, we describe how you can view the statistics in Proactive Campaigns.
Main App Statistics Elements
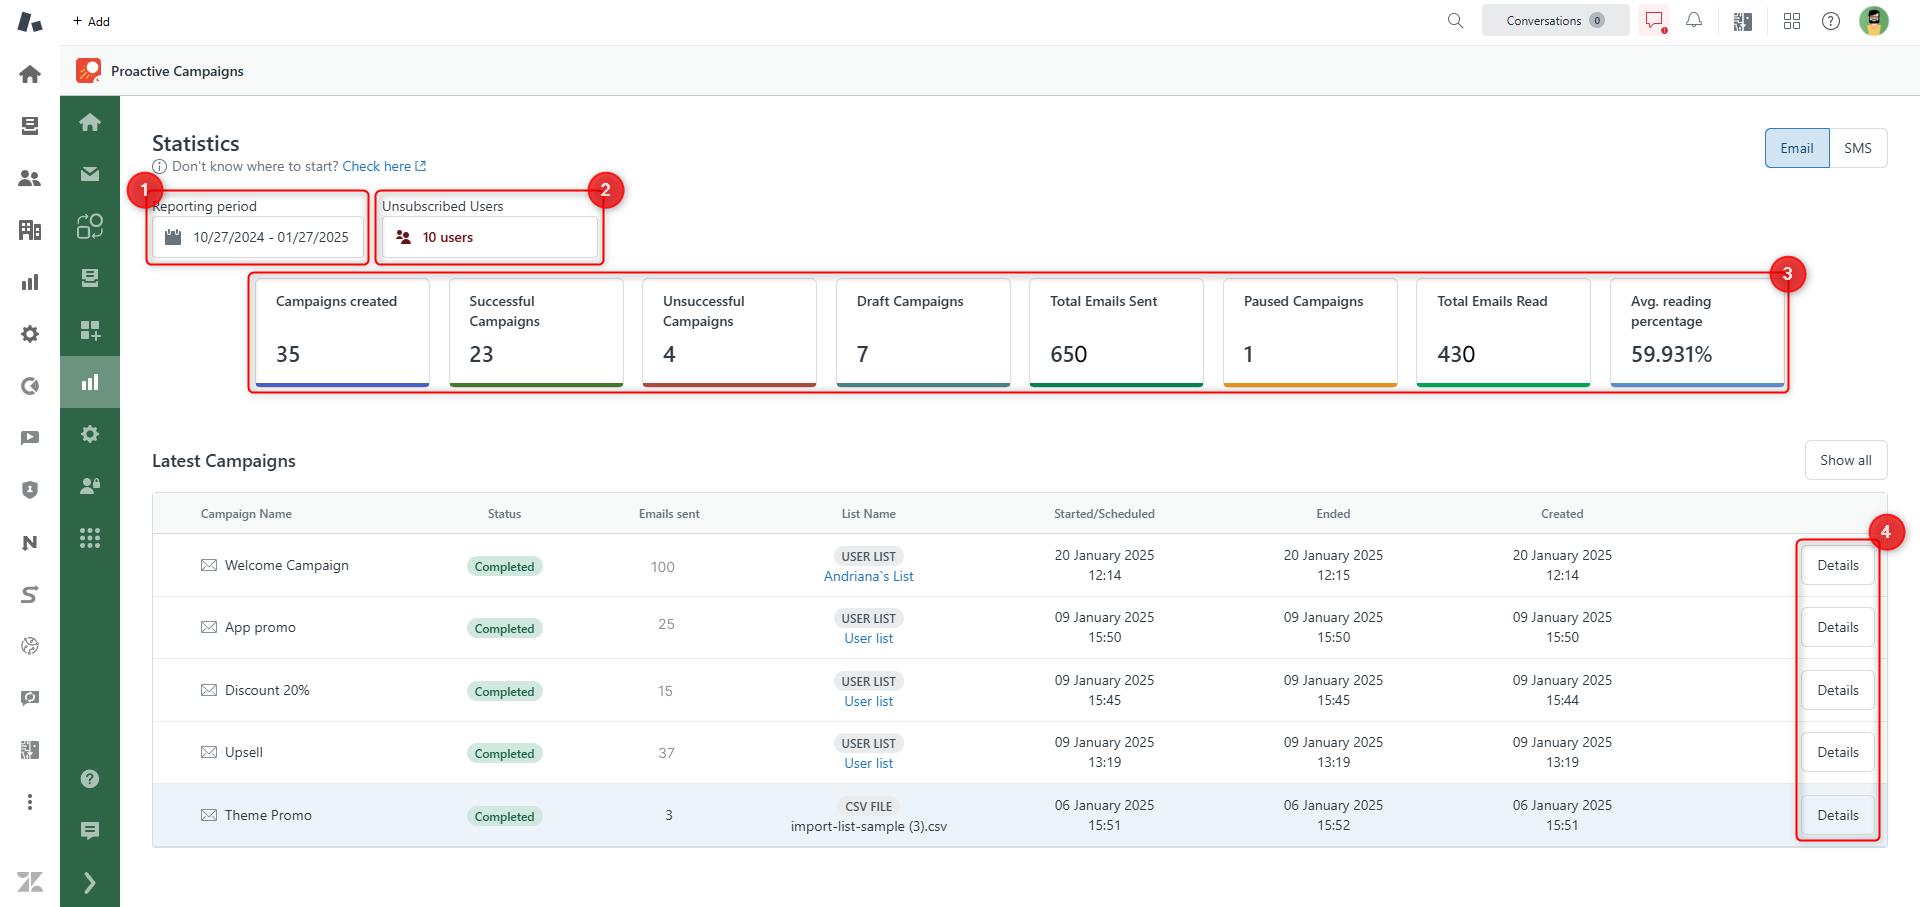
If you need to look over the statistics, go to the Statistics tab in the Proactive Campaigns app.
On this page, you will find the following elements:
- The calendar, on the very top, helps filter campaigns by choosing the Reporting Period.
- Unsubscribed Users section shows the number of users who have unsubscribed from emails for the whole time, so it cannot be filtered by period. Click on this block to see the list of these contacts.
- Blocks with colored lines depict the current campaigns' statuses and the number of sent emails.
- Below, there is a campaign list with specified fields and details of each campaign on the page's left side.
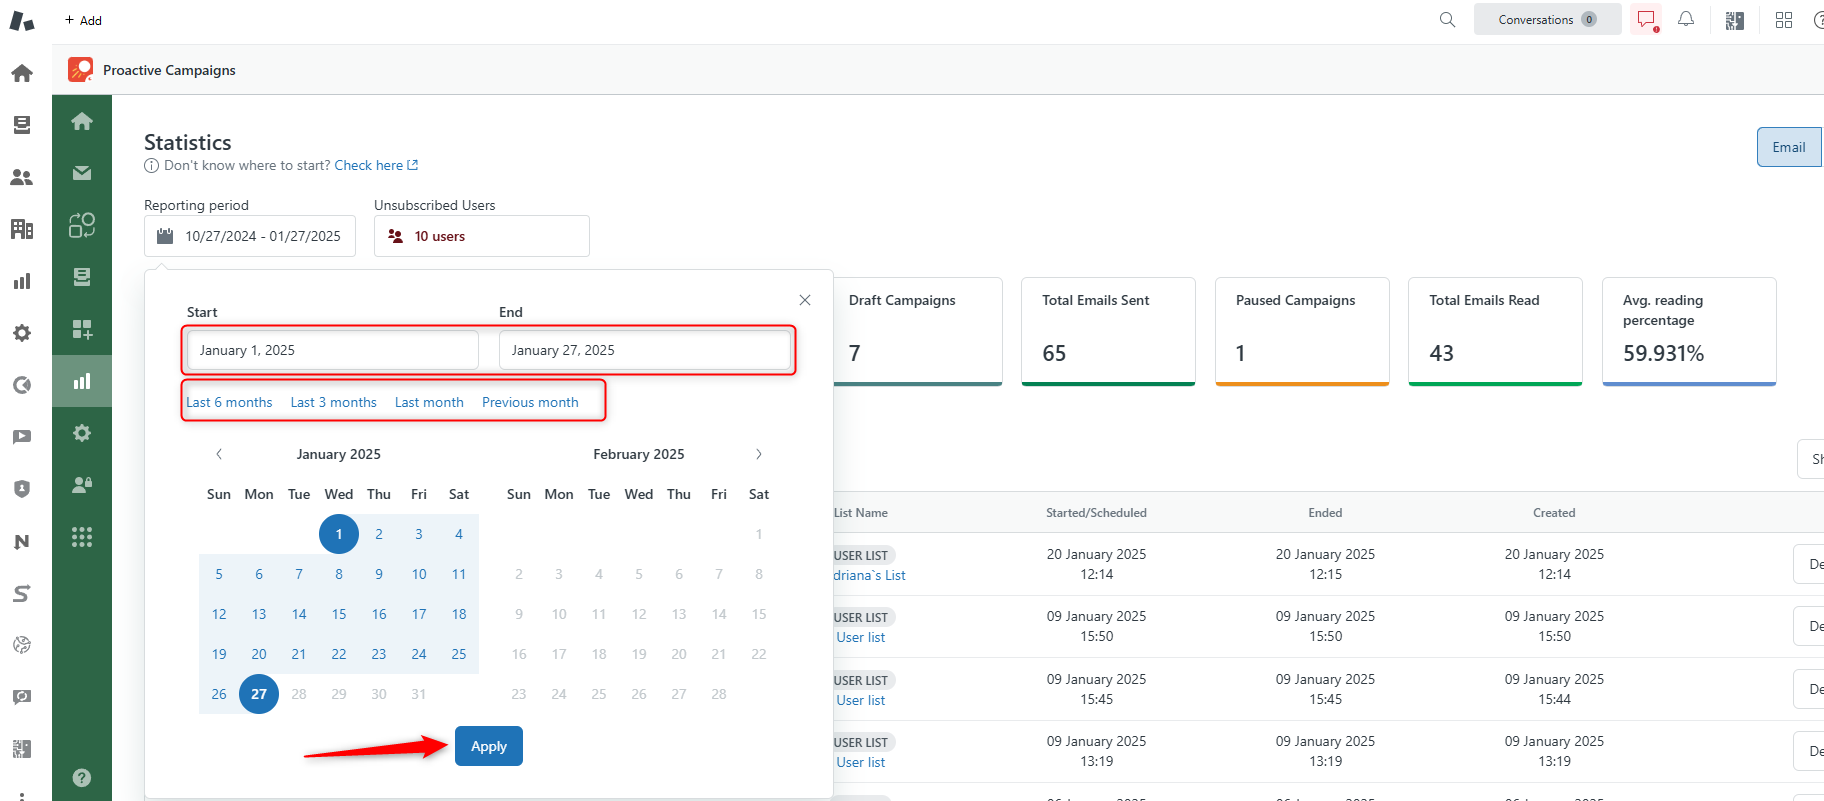
Reporting period
While setting the Reporting period, you can outline the Start and the End dates to see all campaigns created for that period. Also available to choose a specific time such as the Last 6 months, Last 3 months, Last month, or Previous month.
Status Blocks
Rectangular blocks allow viewing statuses for all Campaigns. Moreover, each color indicates at what stage campaigns are:
- Campaigns Created (royal blue): confirms the total number of all created campaigns;
- Successful Campaigns (green): shows the number of successful campaigns. That means that they achieved receivers;
- Unsuccessful Campaigns (red): demonstrates the number of unsuccessful campaigns which were undelivered because of an error;
- Draft Campaigns (prussian blue): shows the number of campaigns that have been saved as drafts and are waiting to be sent;
- Total Emails Sent (hunter green): indicates the total number of sent emails within all created campaigns;
- Paused Campaigns (orange): illustrates the number of paused campaigns you have marked while running them;
- Total Emails Read (light green): depicts the number of emails read by receivers among the total emails sent;
- Average reading percentage by campaign (light blue): proves the percentage of emails read among the sent emails.
Proactive Campaigns List and Details
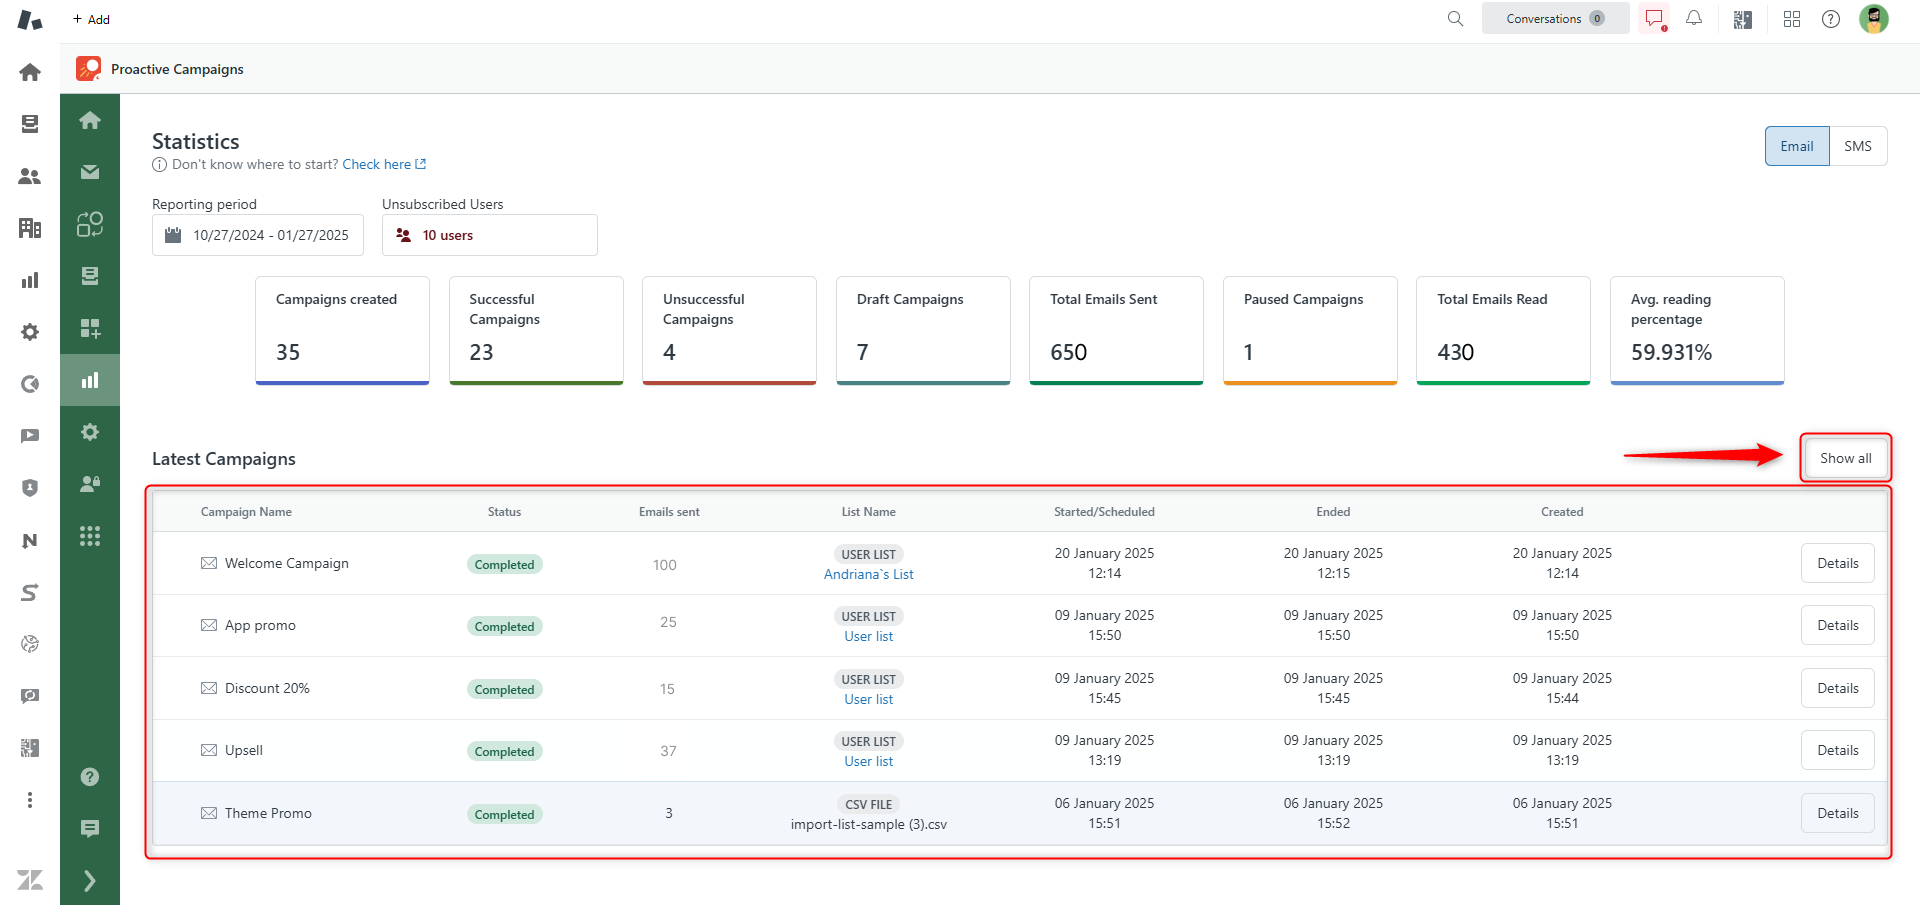
At the bottom part of the page are depicted the 5 last campaigns and their statuses. If you want to see all created campaigns, then click Show all on the right side of the page.
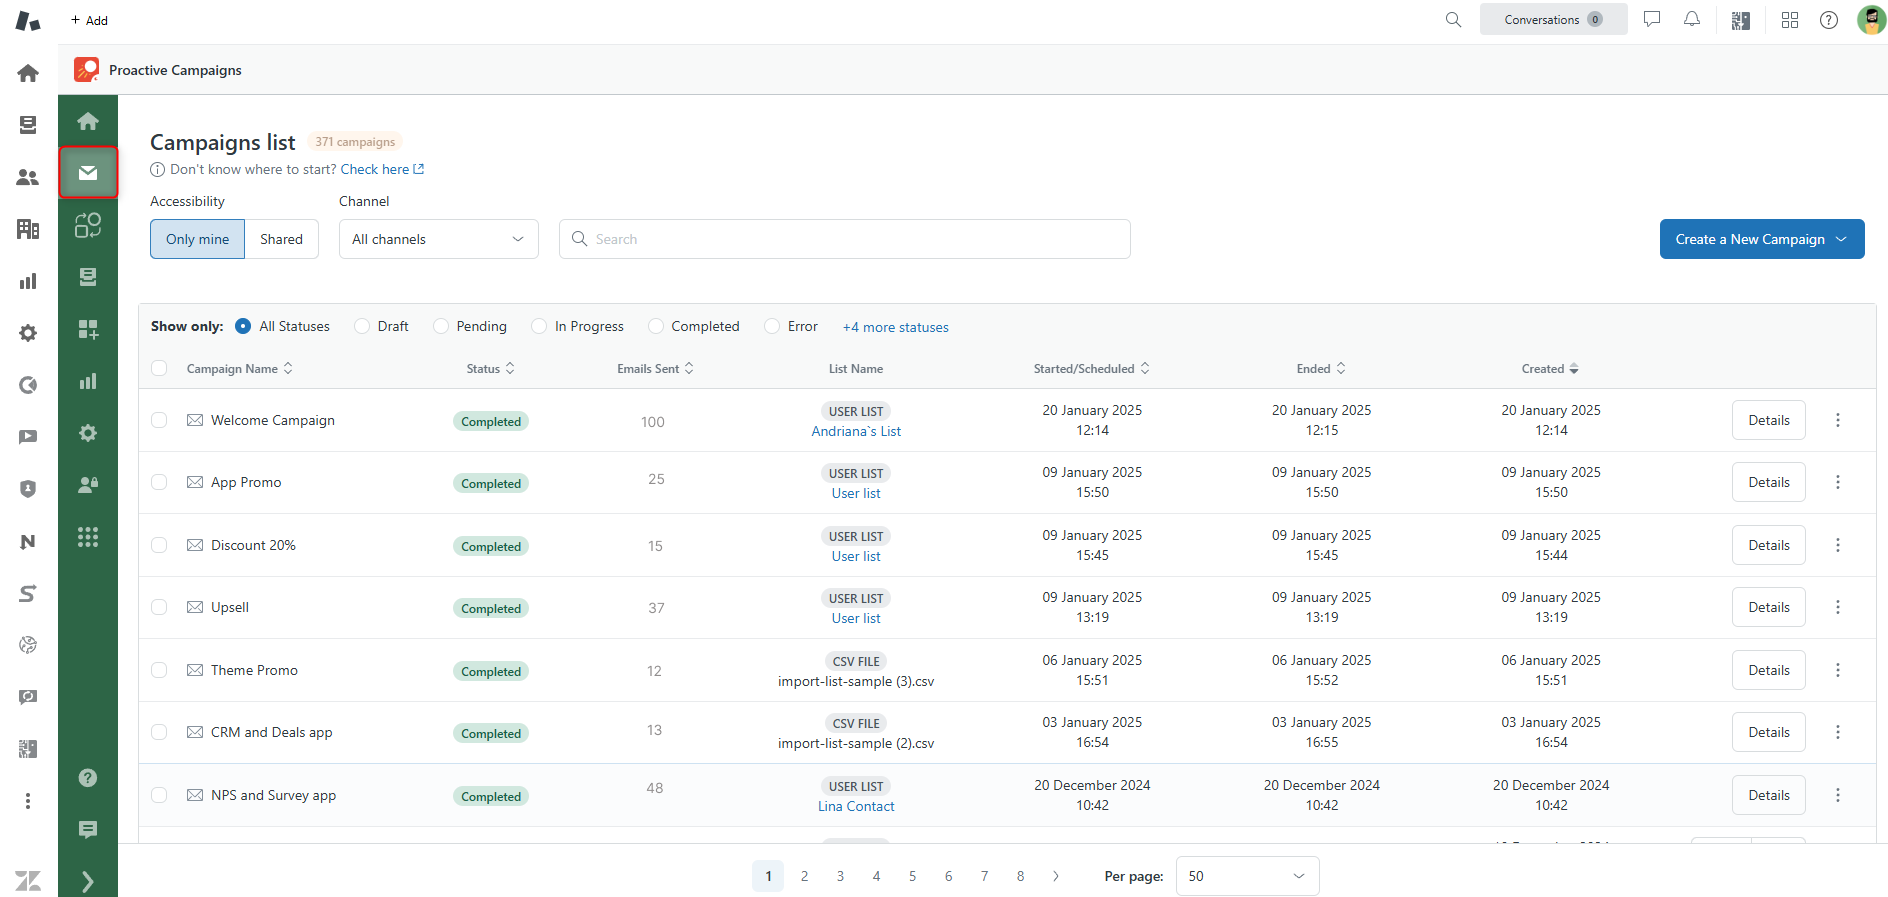
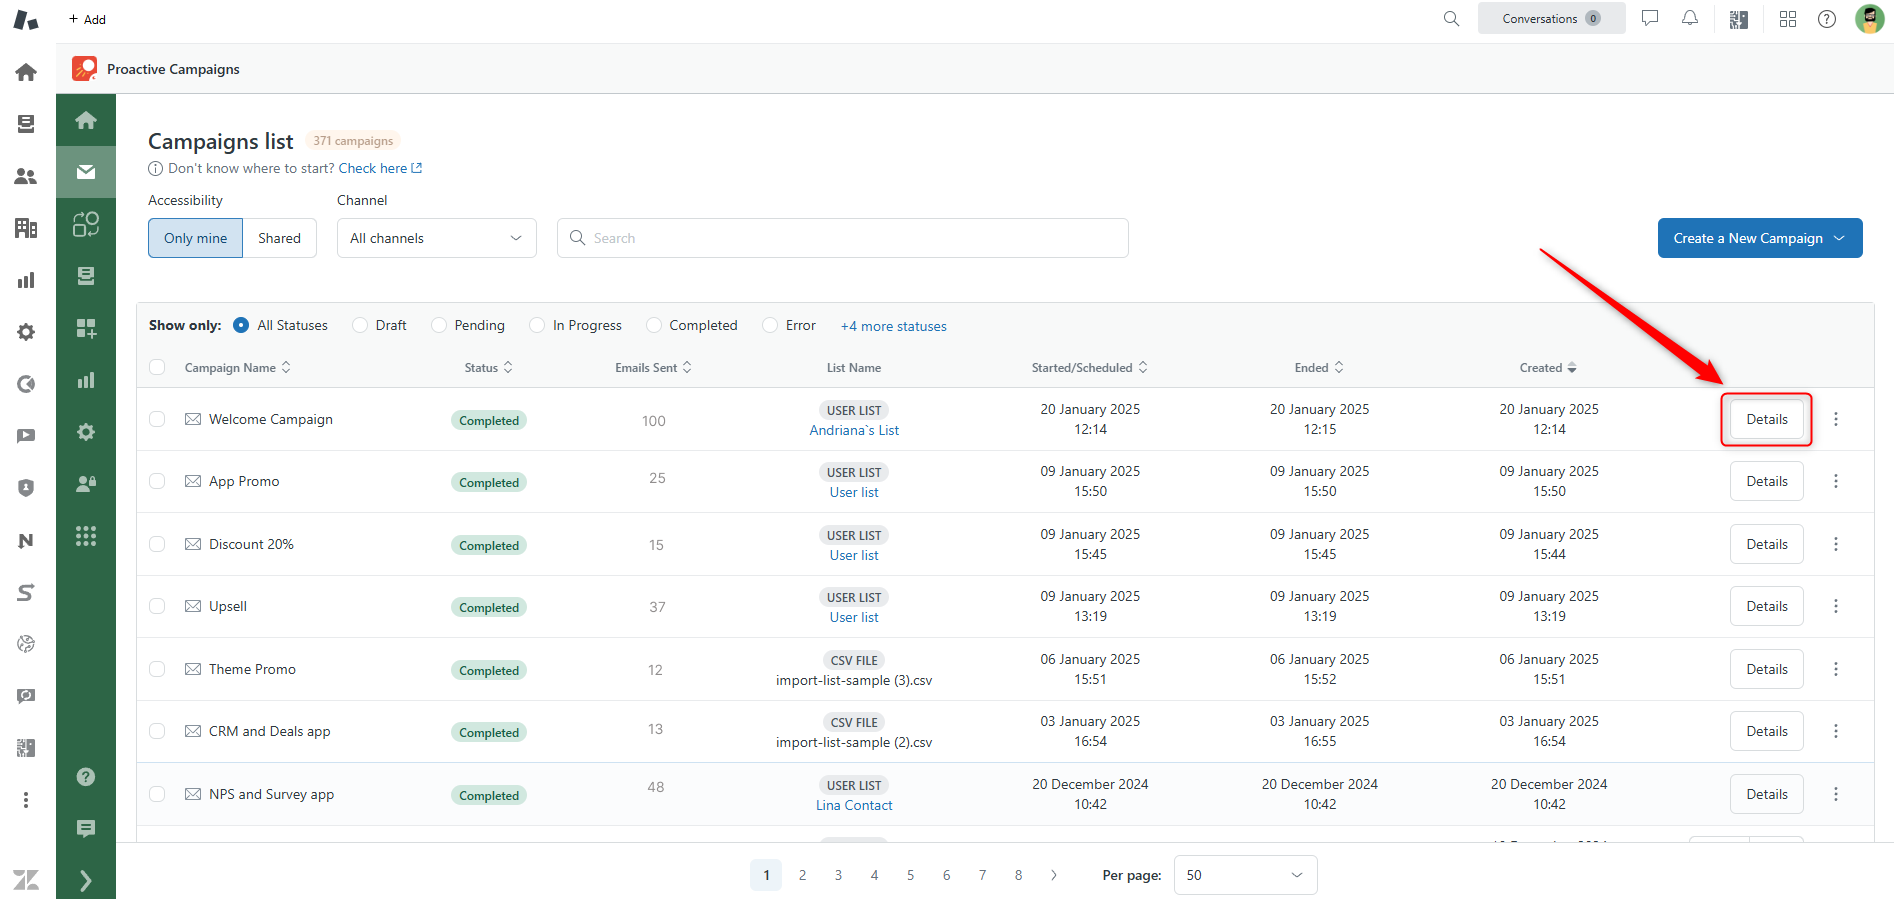
After, the Campaign tab opens with all existing campaigns.
Keep going, and let's cover the next statistics item.
To view the additional information about campaigns, click on the Details button.
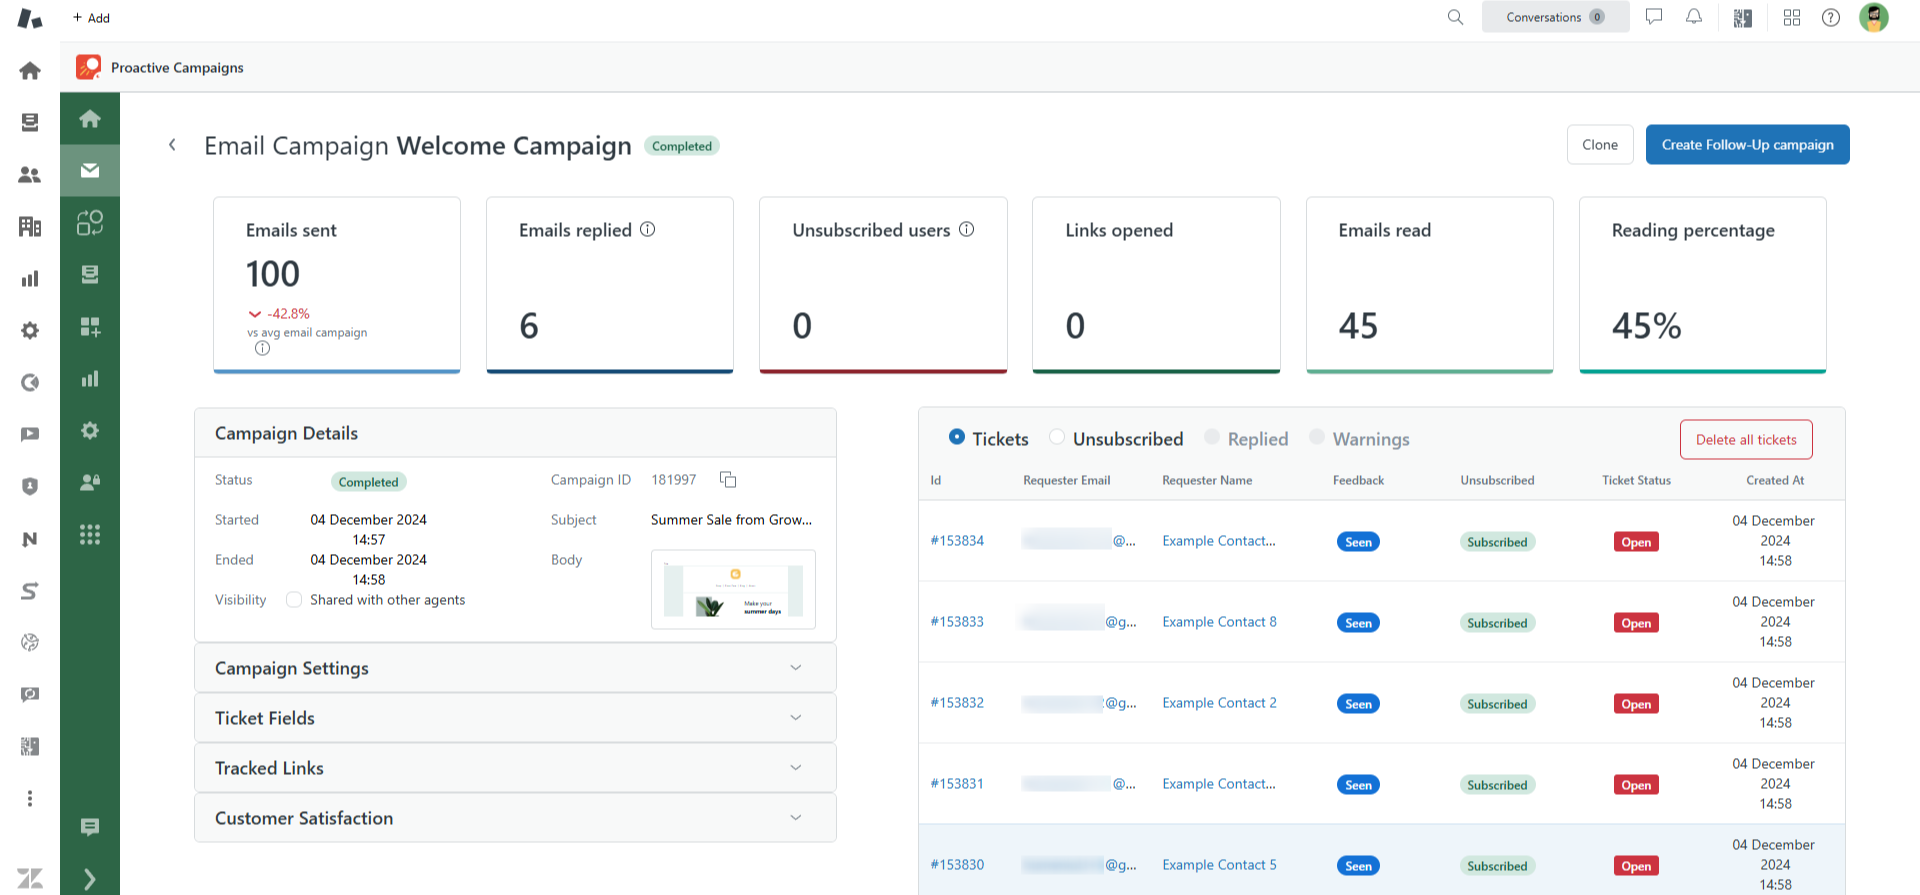
Then, you will see the total number of replies and emails sent in the particular campaign and other details such as Unsubscribed users, Links opened, Emails read, and Reading percentage indicators.
Under the indicators, you will find all campaign details with additional parameters. Also, you can check the list of created tickets. Delete them in bulk anytime with just one click.
So, we've already reviewed the main statistics views stages. Use this information to plan a successful email campaign strategy. Good Luck!
Still, have any questions or want to make suggestions? Do not hesitate to contact us.


